Overview: Following a record eight months of relatively healthy average Kingston PM2.5 airborne particulate levels, June and July were respectively the third- and fourth-worst of the past six years. Our monthly average was 11.5 µg/m3, just slightly lower than June’s 11.6. the third-worst in the past six years. 2023 was more intense from our perspective because many of the fires were closer, in Northern Ontario and Québec. Smoke from this year’s western fires has had time to diffuse somewhat before reaching us. Despite realtively clean air from January through May, Kingston’s year-to-date average PM2.5 exposure is already 6.4 µg/m3, which exceeds both the 5.0 µg/m3 WHO-recommended limit and the 5.8 µg/m3 threshold beyond which excess mortality begins to soar. Unknown to most Kingstonians, our ambient air has been above the WHO limit in 49 of the past 67 months. If you haven’t gotten into the habit of taking self-protective measures on days with high readings, you are risking your health and that of your family. Do you know others who might benefit from more awareness of the reality of our air quality and how they can better protect their health? If so, please share this link: https://kingstonairquality.ca.
by Ron Hartling
The purpose of this page is to raise awareness of the uncomfortable reality that, with respect to fine particulate matter (PM2.5), Kingston air quality is consistently worse than the World Health Organization (WHO) standard. The page gives practical advice on managing household exposure to health-damaging particulates. Updates are posted daily around 7 am. If you live elsewhere in Ontario, click on the “Links” menu item above and read the first entry for guidance on applying this site’s information to your situation. For ease of personal decision-making, overall daily risk levels are categorized by severity in this table.
Note that, while most Canadian and US sources define Risk Level 1 as airborne fine-particulate-matter (PM2.5) concentrations less than 12 micrograms per cubic meter (µg/m3), I employ “Level 0” to differentiate readings within the far more evidence-based, less politically-influenced WHO healthy zone. Click on the Health impacts page for clarification on the differences between short- and long-term exposure risks.
Commentary as of Saturday August 30 at 6:40 am
Current readings: Kingston’s hourly PM2.5 readings yesterday were mostly a healthy 2 and 3 µg/m3 for a daily average 2.3 µg/m3, well down from Thursday’s 3.9. Overnight readings held steady at 3 µg/m3.
Forecast summary: Kingston readings are again likely to remain within the Level-0 range today and hopefully into tomorrow.
Detailed forecast: Environment Canada’s 24-hour forecast for Kingston calls for continuing northwesterly winds all day today, calming overnight, which usually suggests a coming change in direction. The nearest fragment of the Jetstream is likewise northwesterly. No wildfire smoke is expected.
Personal protective measures: No such measures should be required today or tomorrow.
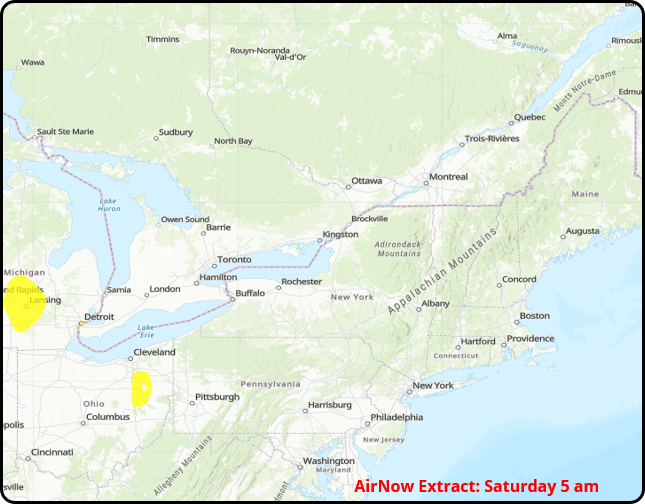
This morning’s 5 am AirNow PM2.5 map extract for northeastern North America shows a couple of yellow-shaded areas of Level-2 particulate concentrations well to our southwest, signifying a Level-1 polluted airmass in that direction.
Summary of recent readings
This table summarizes and provides context for the most recent three weeks of Kingston PM2.5 airborne fine particulate readings. The key numbers are, of course, the daily averages because that’s what informs us how our recent exposures have contributed to or ameliorated whatever annual exposure to toxic particulates we are comfortable with or accepting of. For those who choose to lower their at-home exposure in order to better protect their and their households’ long-term health, the numbers provide important information on how much effort may be required to stay within their comfort levels.
To facilitate that analysis, the table also computes each day’s risk category (usually a mix of 0’s, 1’s and 2’s), as well as 7- and 28-day running averages and medians. It also reports on the minimum and maximum readings for each day, as well as on the number of hours that day during which Kingston PM2.5 readings may have exceeded either or both the World Health Organization’s recommended maximum and the seriously outdated and therefore misleading US/Canadian equivalent.


